Copper Price Hits New Highs in 2026
Copper Price Hits New Highs in 2026 – What’s Driving the Rally?
At the start of 2026, copper prices have once again broken historical records. What’s behind this surge?
On January 5, LME copper prices touched $13,000 per ton for the first time, briefly approaching $13,020 intraday. This breakthrough follows an impressive year: in 2025, copper gained over 43%, marking its strongest annual performance since 2009.
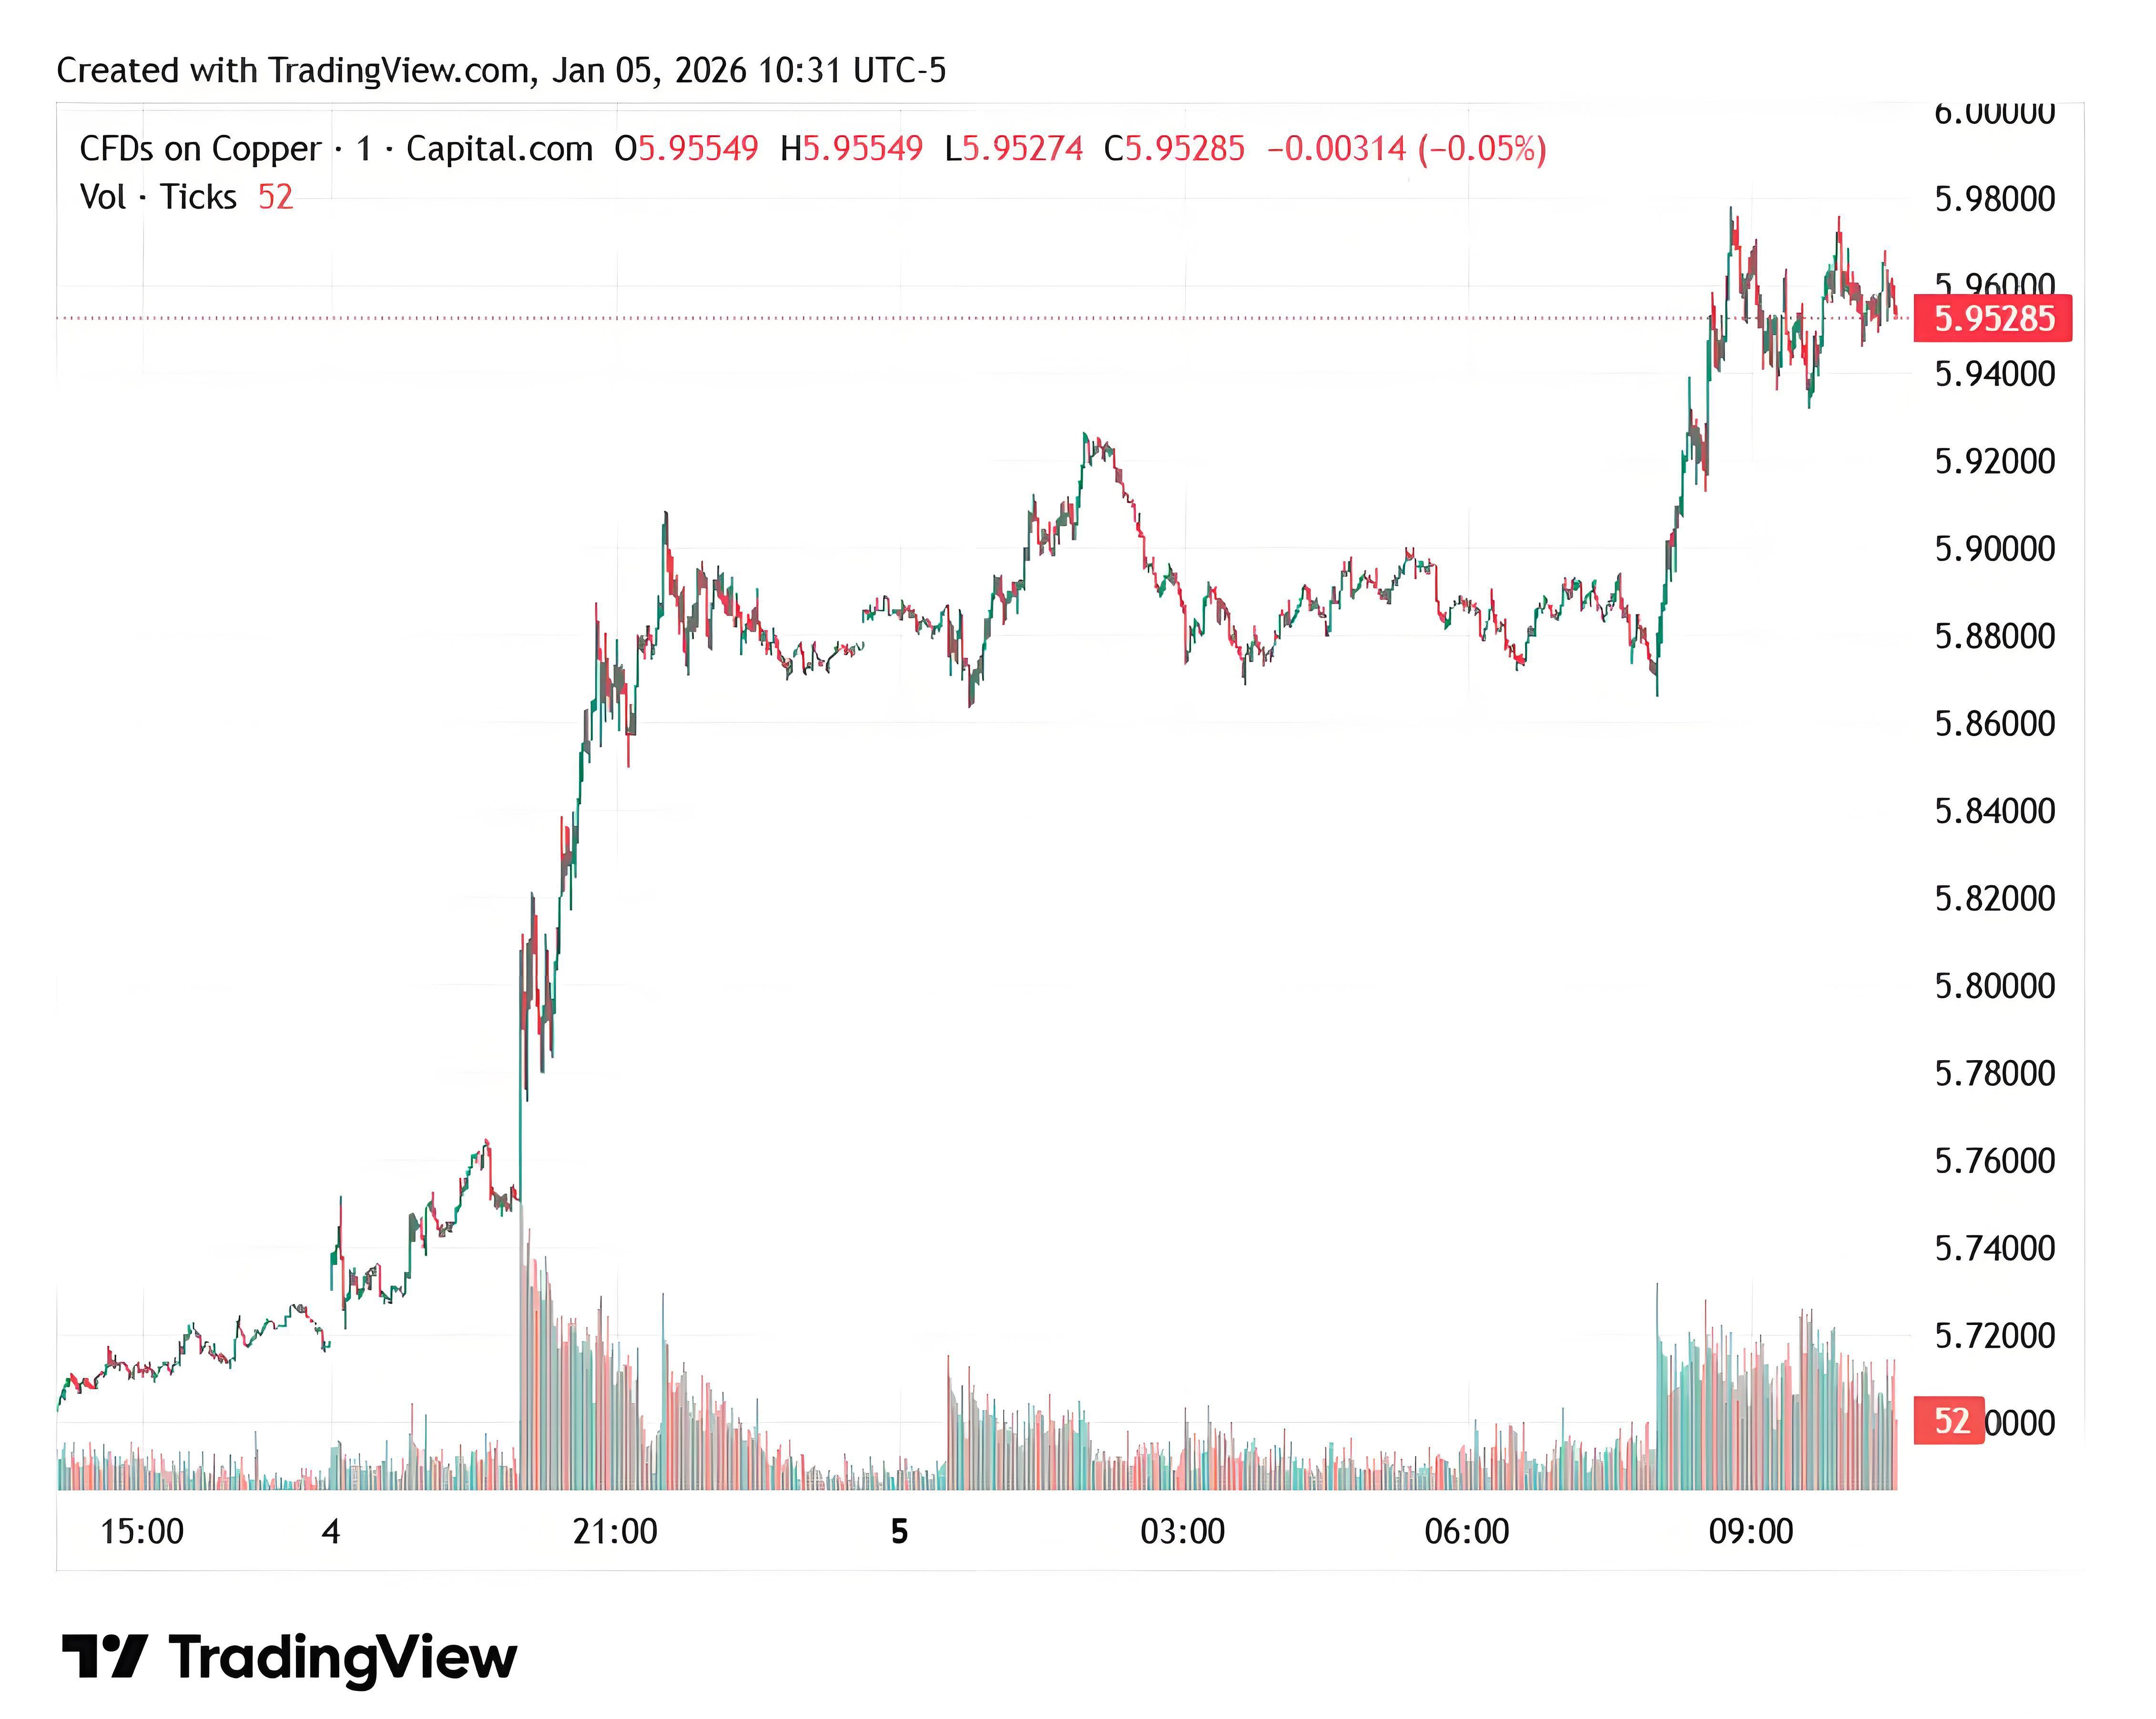
Among the six major industrial metals traded on the LME, copper was the top performer in 2025 — and this was no coincidence.
1. A Historical Perspective from the Charts
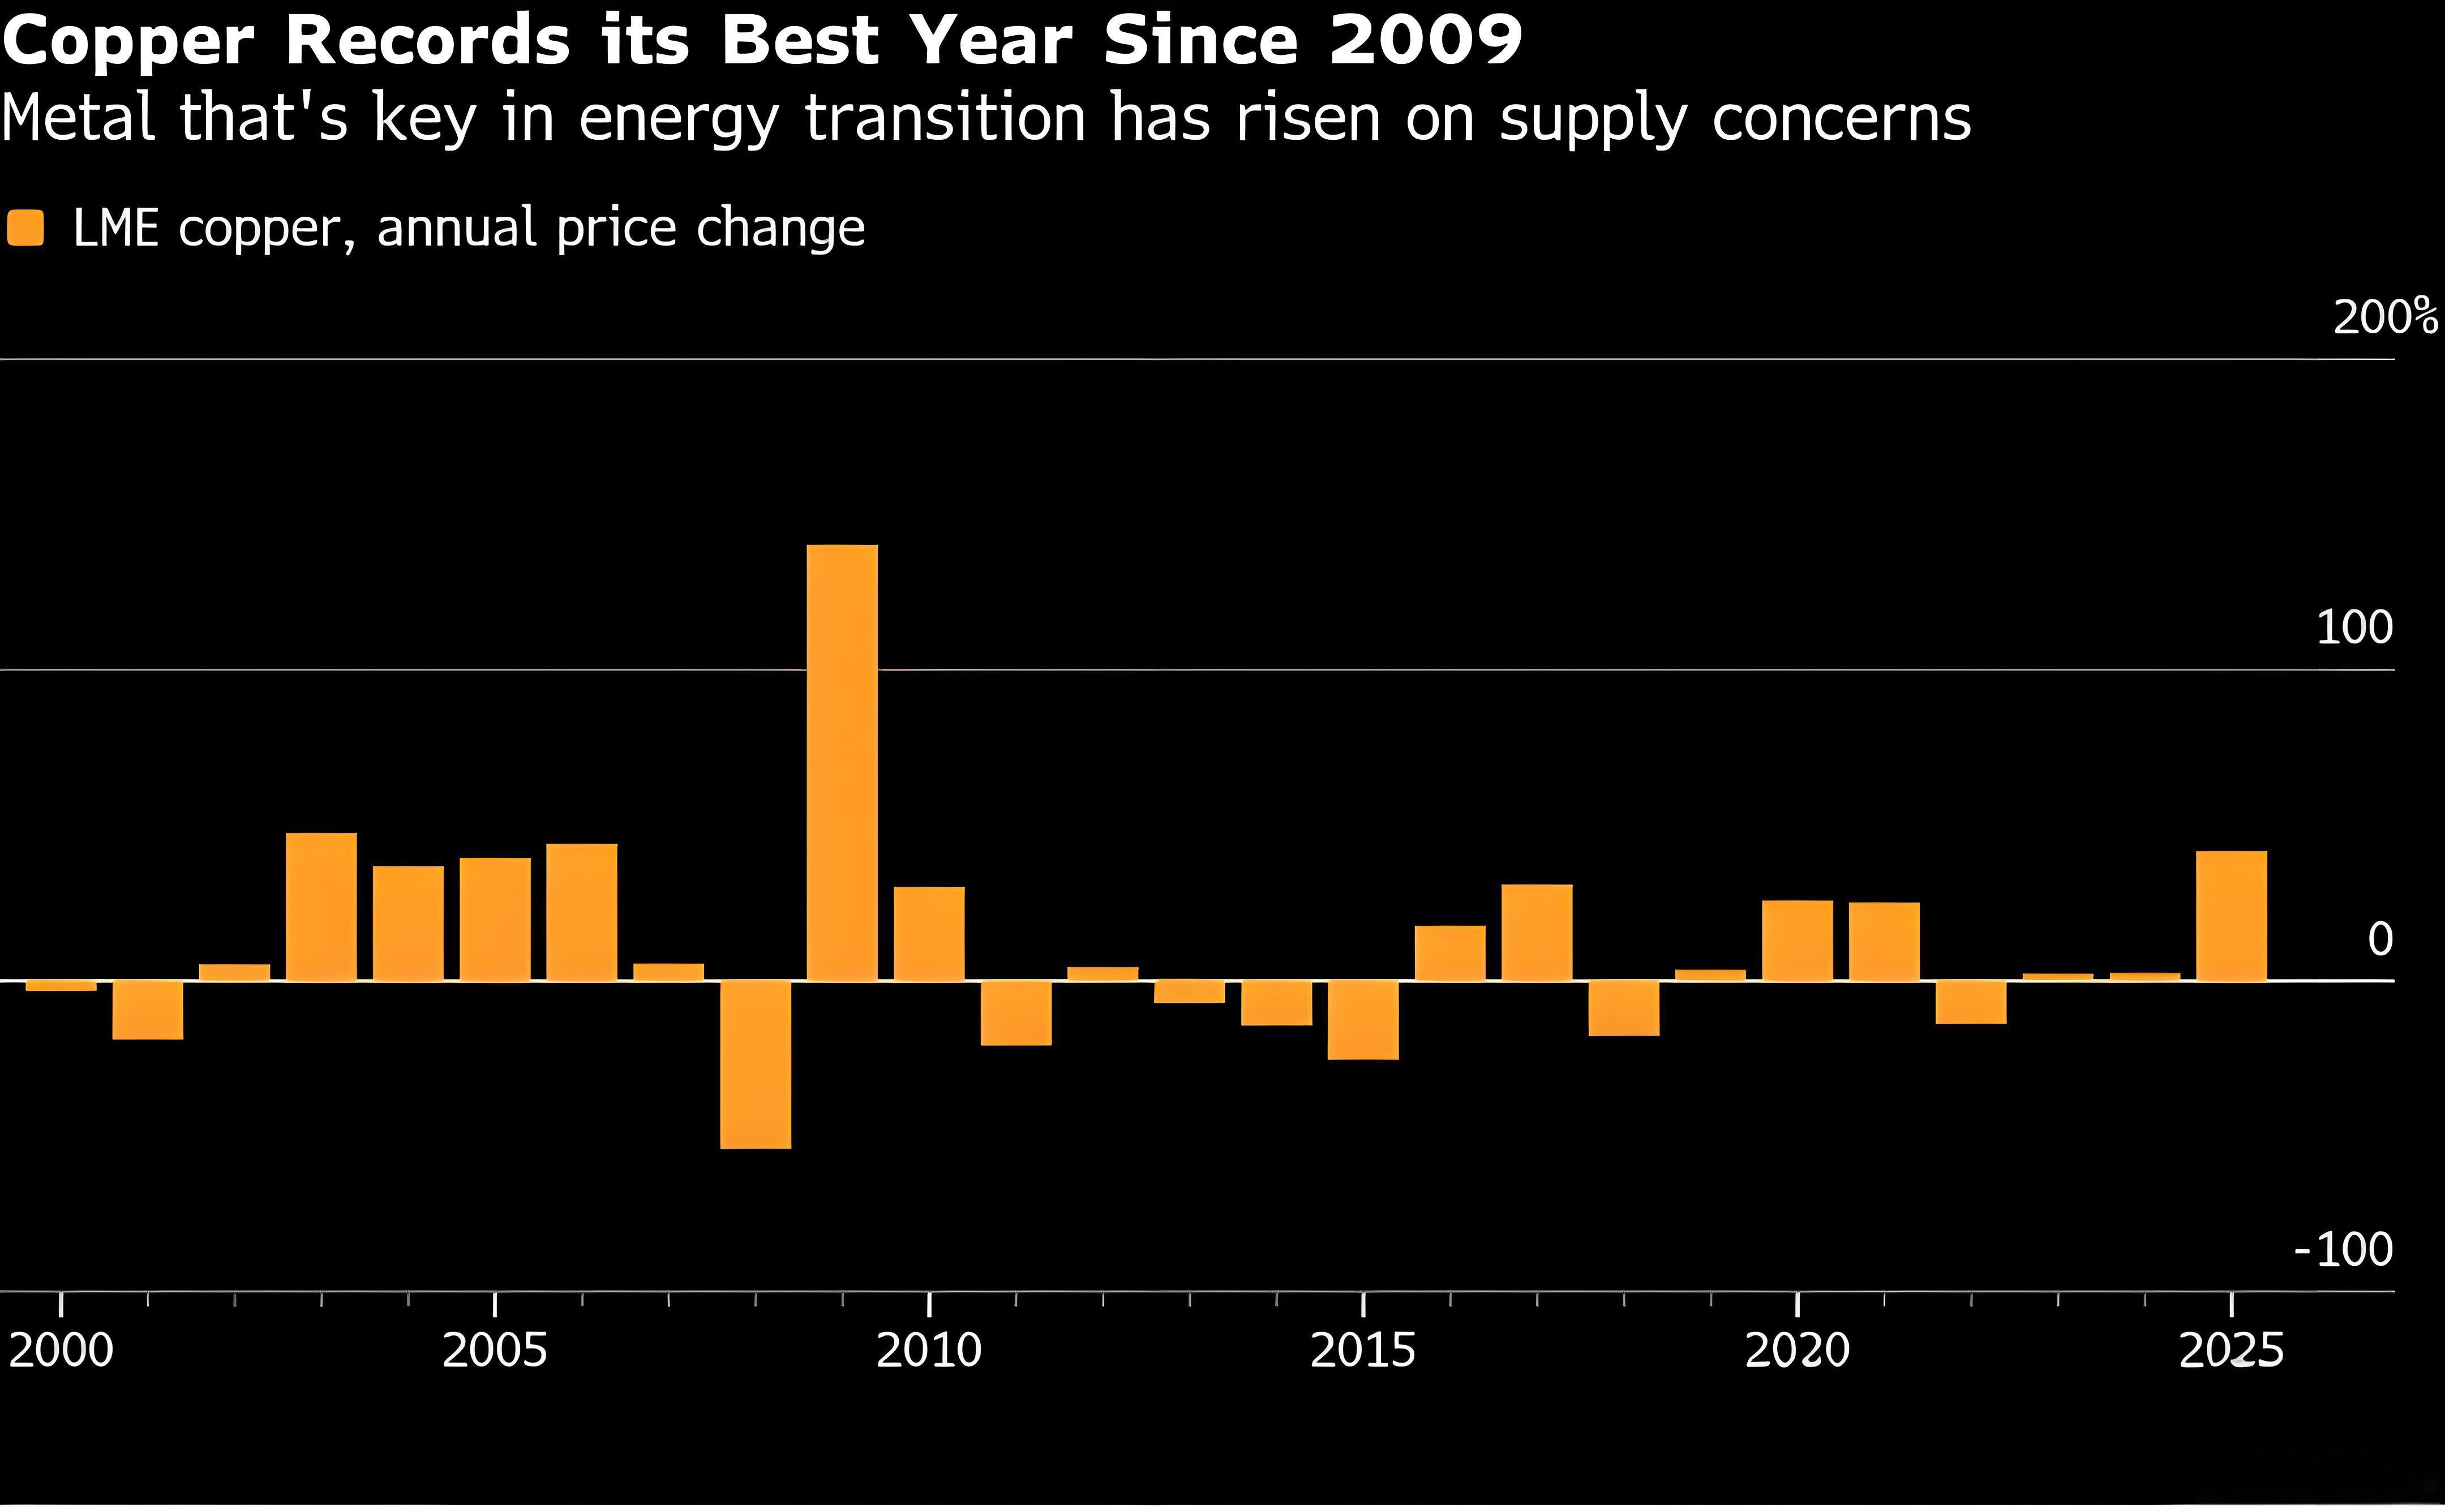
2025 was a breakout year not seen in over a decade. Looking at annual copper price changes on the LME:
· 2009: a post-financial crisis rebound (+100%+)
· The following decade saw cyclical swings, but nothing comparable
· 2025: gains of around 42%–43%
The difference?
· 2009 was a crisis recovery.
· 2025’s rally happened under normal economic conditions.
This suggests copper is being repriced.
---
2. Persistent Supply-Side “Bleeding”
In 2025, multiple key copper mines faced significant output disruptions, including:
· Grasberg in Indonesia
· Kamoa-Kakula in the DRC
Tensions have continued into 2026. Recent strikes at Chile’s Mantoverde copper mine have reignited market concerns.
Al Munro, Senior Base Metals Strategist at Marex, noted: “This is a spec-driven rally. The market still sees upside, especially in Q1 2026, with many waiting for a pullback now forced to enter.”
ING’s view is even clearer: “Years of underinvestment + ongoing mine disruptions leave the market with almost no buffer.”
3. What’s Amplifying the Move: “Tariffs + Stockpile Mismatch”
Recent expectations that the U.S. may reimpose copper tariffs have redirected global copper flows. The result?
· Traders accelerating shipments to the U.S.
· Rising U.S. inventories
· Tighter physical supply elsewhere
UBS highlights a key imbalance:
· The U.S. holds about 50% of global copper stocks
· But accounts for less than 10% of global demand
👉 Stockpiles are concentrated where they aren’t being consumed.
👉 The rest of the world is effectively left short of copper.
---
4. The Physical Market Is Already Telling the Story
A key signal from the LME right now:
· Persistent backwardation in the cash-to-3-month spread
This usually happens for one reason: genuine near-term tightness.
From mine disruptions and tariff distortions to structural inventory imbalances, this copper rally isn’t just sentiment-driven. It reflects:
· The culmination of long-term supply underinvestment
· Policy-driven market distortions
· Money following the narrative
$13,000/ton looks more like a milestone than the final chapter.
Remarks: This analysis is by Yuner, Canada
-
Phase 1 Kicks Off: New Layout for Pump Zones & “Land and Go” Badge Pick-up at Airport
The Canton Fair pump pavilion has moved to Hall 6.1. For those of you who regularly source there, don't get lost! Badge pickup is now also available at the airport-much more convenient.
넶10 2026-04-15 -
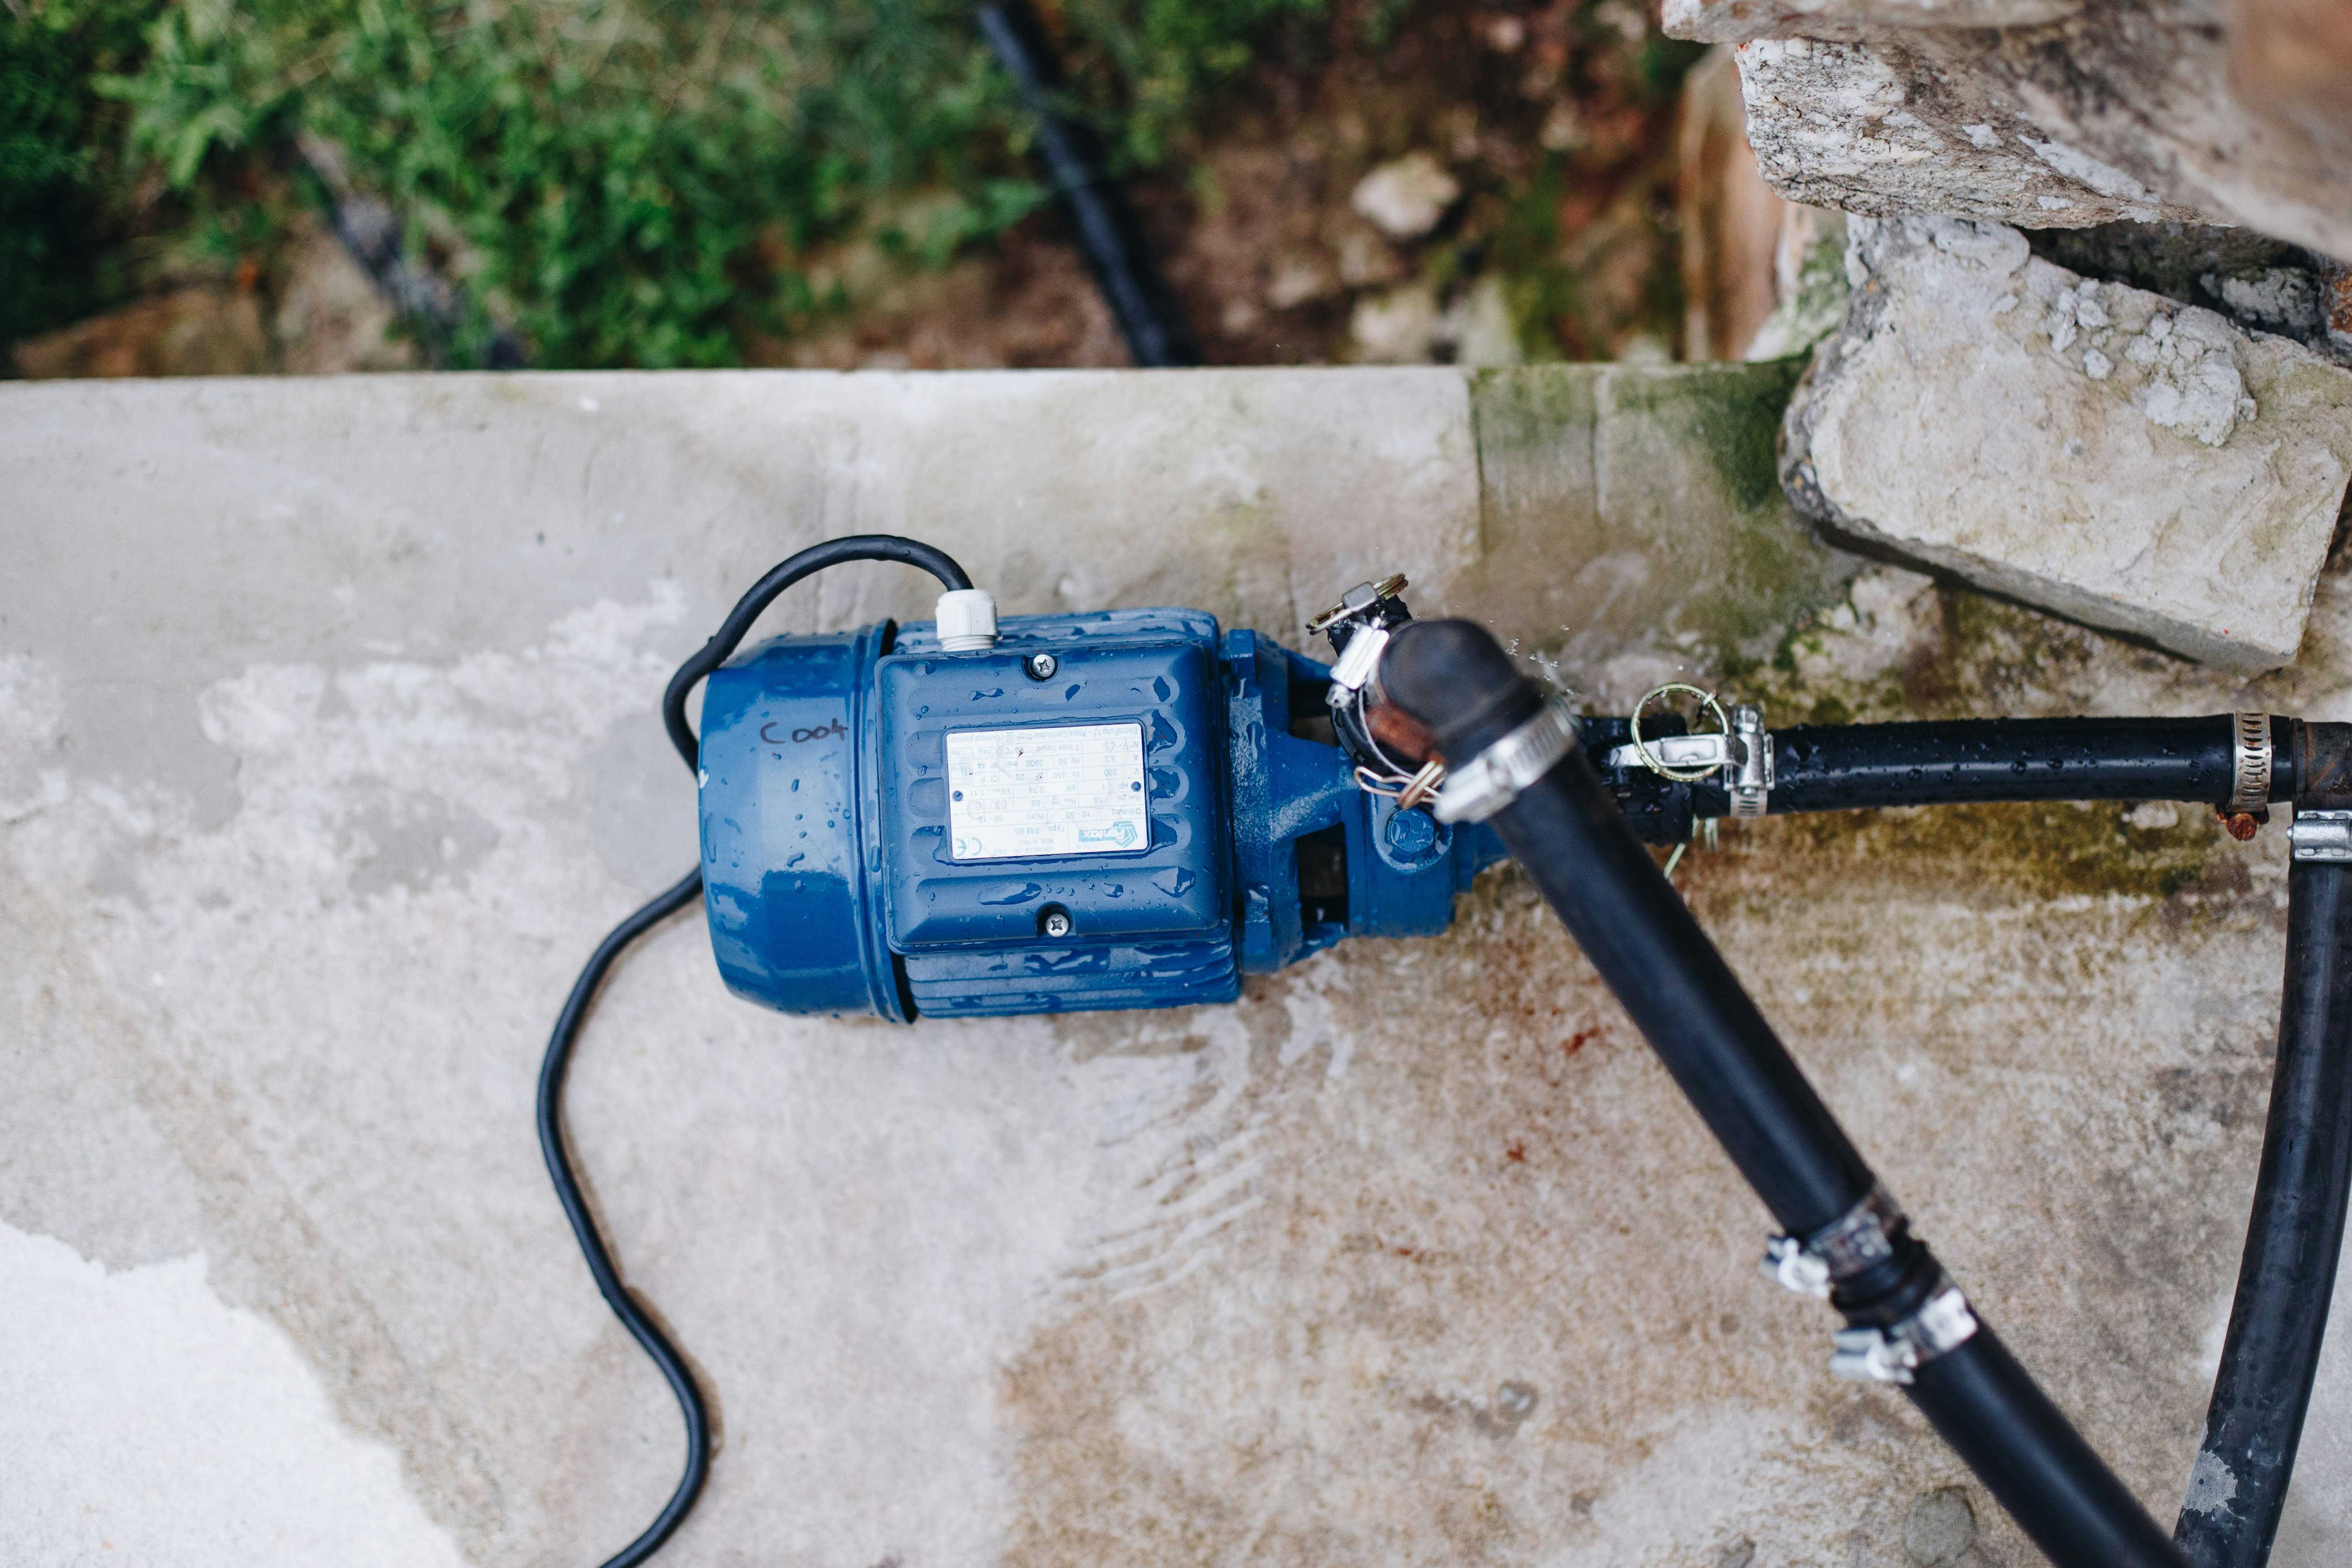
Spring Startup Guide for Garden Pumps: Key Maintenance Tips After Winter Dormancy
Avoid Costly Repairs-How to Safely Reactivate Your Water Pump for the New Season
넶7 2026-04-03 -
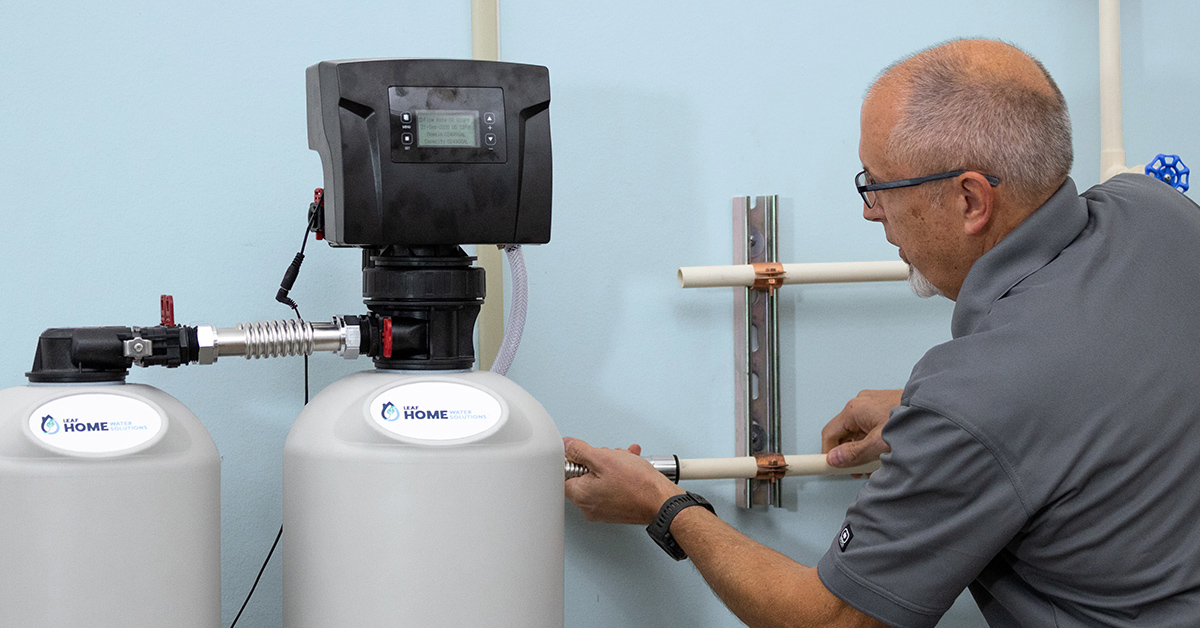
The Silent Guardian of Your Home Water System
Why Stainless Steel Flexible Hoses Are Essential for Pumps, Water Heaters, and Beyond
넶15 2026-03-27 -